
TL;DR:
- Slow, laggy apps can negatively impact user engagement, revenue, and brand reputation.
- Implementing structured, metrics-driven performance optimization processes helps identify and fix bottlenecks effectively.
Slow, laggy apps are not just a technical inconvenience. They cost businesses users, revenue, and reputation. Mobile app performance directly impacts user engagement, retention, and business results, yet many development teams still treat optimisation as an afterthought rather than a core discipline. This guide walks you through everything from setting the right baseline metrics to running structured improvement cycles, with practical techniques that apply whether you are building for retail, healthcare, or non-profit audiences. You will leave with a repeatable process, not just a checklist.
Table of Contents
- Essential preparation: tools and metrics for app performance
- A step-by-step process: measurement-first optimisation
- Practical techniques: speeding up start-up and user journeys
- Device adaptation and efficient asset delivery
- Framework-specific performance: React Native and modern architectures
- Our take: optimising for outcomes, not just numbers
- Need help optimising your app?
- Frequently asked questions
Key Takeaways
| Point | Details |
|---|---|
| Measure first, optimise bottlenecks | Profile and instrument your app journeys before changing code, then target the bottlenecks. |
| Prioritise user journey metrics | Choose metrics that reflect real customer success, not just raw speed. |
| Optimise for real devices | Always validate improvements on physical devices across capability bands. |
| Iterate and monitor | Ongoing monitoring and refinement are essential for sustainable performance gains. |
| Update framework architecture | Upgrading project foundations—like React Native’s Fabric—unlocks significant speed improvements. |
Essential preparation: tools and metrics for app performance
Before you touch a single line of code, you need clarity on what you are actually measuring and why. Too many teams jump straight into profiling tools without first defining which performance failures are genuinely hurting the business.
Start by aligning performance goals with your key business KPIs. For a retail app, that might be reducing the time from launch to first product view. For a healthcare app, it could be the completion rate of a critical booking flow. For a charity or non-profit, it might be the percentage of users who successfully complete a donation. Performance work that does not connect to these outcomes risks being invisible to stakeholders and easy to deprioritise.
Once you have those goals, collect baseline data across both technical and behavioural dimensions. Core business and technical metrics to track include app load time, latency, crash rates, and user journey analytics. Raw technical numbers tell you where the friction is. Journey analytics tell you whether that friction is costing you conversions.
| Metric category | Example metrics | Business relevance |
|---|---|---|
| Technical performance | Load time, frame rate, crash rate | Identifies engineering bottlenecks |
| User behaviour | DAU/MAU, session length, churn | Reveals real-world user impact |
| Journey analytics | Funnel completion, drop-off points | Ties performance to revenue |
| Infrastructure | API latency, memory usage | Flags scalability risks |
Key tools to have in your baseline toolkit include:
- Firebase Performance Monitoring for real-user performance data and network tracing
- Android Studio Profiler and Xcode Instruments for native-level diagnostics
- Crashlytics for crash rate tracking and stack trace analysis
- Mixpanel or Amplitude for journey-based behavioural analytics
- Lighthouse for web-based or PWA performance auditing
Good user experience optimisation starts here, with honest data. You cannot fix what you cannot see, and journey-based metrics often reveal that the bottleneck is not where you assumed it was.
Pro Tip: Do not rely solely on emulator data. Real users on mid-range devices with variable network conditions will expose issues that never surface in development environments. Supplement automated tooling with structured app usability testing to catch what numbers alone miss.
The relationship between performance and discoverability is also worth noting. User experience for SEO signals show that speed improvements feed into broader digital performance, reinforcing the case for treating app performance as a business investment rather than a purely technical concern.
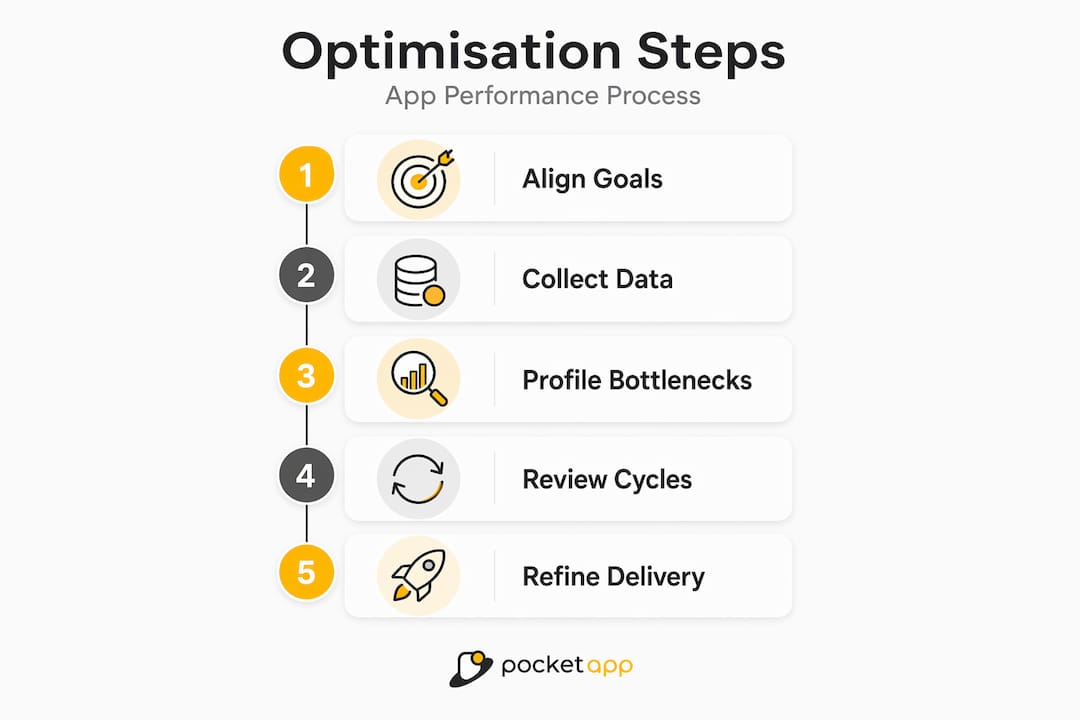
A step-by-step process: measurement-first optimisation
Once you are set up with the right metrics and tools, it is time to work through the optimisation process in a structured way. Jumping to solutions before understanding the problem is the single most common cause of wasted effort in performance work.
A measurement-first process involves profiling, bottleneck identification, real-device testing, production monitoring, and iteration. This sequence matters. Skipping profiling and going straight to code changes almost always means fixing the wrong things.
Here is the recommended process:
- Profile the app end-to-end. Use instrumentation tools to capture timing data across the full user journey, not just individual screens. Identify where wall-clock time is being spent.
- Rank bottlenecks by user impact. Not all slow code is equal. A 400ms delay in a background sync matters far less than a 400ms delay on the checkout confirmation screen. Prioritise by journey criticality.
- Form a hypothesis and make a targeted change. Change one variable at a time. This makes it possible to attribute improvements to specific actions rather than a batch of changes.
- Test on real devices across the capability spectrum. A flagship device will mask performance problems that a mid-range device from two years ago will expose immediately.
- Deploy to a subset of users and monitor production signals. Staged rollouts via feature flags let you validate improvements without exposing the full user base to risk.
- Review results and iterate. Compare post-change metrics against your baseline. If the improvement is meaningful, document it and move to the next bottleneck.
| Optimisation approach | Advantage | Risk if skipped |
|---|---|---|
| Profiling before changes | Targets real bottlenecks | Wasted effort on low-impact fixes |
| Real-device testing | Catches device-specific regressions | Missed failures for mid-range users |
| Staged rollout | Limits blast radius of regressions | Full user base impacted by issues |
| Post-change monitoring | Validates actual improvement | False confidence from emulator results |
This process should be built into your mobile app discovery phase, not bolted on after launch. Defining performance thresholds as acceptance criteria from the outset changes the conversation entirely.
Pro Tip: Treat ongoing app maintenance cycles as structured performance review windows. Schedule a profiling session after every major release rather than waiting for users to report slowdowns. The website speed for conversions parallel holds here too: speed gains compound over time when they are pursued consistently.
Practical techniques: speeding up start-up and user journeys
With your process established, let us apply it where it creates the most impact: the first seconds of the user experience. Start-up time and time-to-interactive (TTI) are the metrics that shape a user's first impression and, critically, their decision to continue using the app at all.
The guiding principle is simple: prioritise what the user sees and can interact with, and defer everything else.
Key stat: Non-blocking and deferred loading of non-critical work can significantly reduce app start-up times. Duolingo applied this approach to reduce cold start time on Android by deferring work that did not affect the visible UI or the user's first interaction.
Here is how to apply this in practice:
- Audit your app start-up sequence. List every task that runs before the first screen is usable. Most apps initialise analytics SDKs, crash reporters, and background sync during cold start. Many of these can be deferred.
- Use lazy loading for non-critical modules. Load libraries and features only when they are actually needed, not at app launch.
- Prioritise above-the-fold rendering. Ensure the first meaningful UI elements appear as quickly as possible, even if supporting data is still loading. Skeleton screens and progressive loading states manage perceived performance effectively.
- Implement non-blocking data fetches. Network calls that are not required for the initial render should be dispatched asynchronously. Blocking the main thread for remote data is one of the most common causes of janky start-up experiences.
- Cache aggressively for returning users. The difference between a cold start and a warm start should be dramatic. Returning users should rarely wait for data that has not changed since their last session.
This directly supports efforts to improve app UX, since perceived speed has an outsized effect on satisfaction scores and retention rates. Pair these changes with usability testing for UX to validate that optimisations are translating to a genuinely better experience, not just improved benchmark numbers.
Device adaptation and efficient asset delivery
With critical paths handled, the next challenge is ensuring your app performs well across the full spectrum of devices your users actually own, not just the devices your team tests on.

The most effective approach is to group devices into capability bands rather than maintaining fragile whitelists of specific models. A capability band might be defined by available RAM, GPU tier, or CPU benchmark score. This lets you write adaptive logic that scales gracefully without requiring constant maintenance as new devices emerge.
Beyond capability grouping, dynamic runtime adaptation is essential. Continuously adapting to runtime conditions such as memory pressure or frame drops, and handling image assets with progressive loading and efficient formats, ensures your app remains responsive even when the device is under load. Practical runtime signals to monitor include:
- Available memory headroom (trigger lower-resolution asset loading when memory is constrained)
- Thermal state (reduce background processing when the device is throttling due to heat)
- Network quality (switch to compressed assets or defer media loading on slow connections)
- Frame rate signals (reduce animation complexity if the rendering pipeline is struggling)
Asset delivery is the other major lever. Images and large payloads dominate load time, so optimising using compression, modern formats, and caching is non-negotiable. WebP delivers significantly smaller file sizes than JPEG or PNG at comparable quality. Progressive image loading ensures users see something useful immediately rather than staring at blank containers.
"Optimising image assets and implementing multi-layer caching can eliminate a significant proportion of unnecessary network traffic and dramatically improve perceived performance across device tiers."
Multi-layer caching means implementing memory cache, disc cache, and network caching in combination. A well-structured cache strategy ensures that assets are retrieved from the fastest available source, reducing both latency and data usage for your users. These considerations also feed directly into app design tips, where design and performance decisions must align to avoid visually ambitious screens that punish lower-tier devices.
Framework-specific performance: React Native and modern architectures
For those using cross-platform or hybrid solutions, targeting framework-specific bottlenecks is essential. React Native (RN) is widely used across the industries Pocket App serves, and it comes with a distinctive set of performance characteristics that differ meaningfully from fully native development.
The older RN bridge architecture, where JavaScript and native code communicate via a serialised message queue, is a well-known bottleneck. Frequent, large, or synchronous bridge calls can cause dropped frames and sluggish interactions. React Native performance issues are often rooted in default configurations and can be mitigated through migration to Fabric and TurboModules, alongside structured checklists.
Common React Native performance pitfalls to address:
- Unnecessary re-renders: Use "React.memo
,useMemo, anduseCallback` to prevent components from re-rendering when their props have not changed. - Large bundle sizes: Enable Hermes (the optimised JavaScript engine), use code splitting, and remove unused dependencies to reduce start-up time.
- Unoptimised list rendering: Use
FlatListorSectionListwith properkeyExtractorandgetItemLayoutconfigurations rather than rendering all list items simultaneously. - Heavy bridge traffic: Audit bridge calls and move performance-critical operations closer to the native layer.
The upgrade path to modern RN architectures is well-defined:
- Audit your current RN version and identify deprecated APIs.
- Migrate to Hermes if not already enabled.
- Enable the New Architecture (Fabric renderer and TurboModules) incrementally.
- Use Flipper or React Native Performance Monitor to validate improvements at each stage.
- Address any third-party library incompatibilities before full rollout.
For teams working on cloud mobile apps, the React Native upgrade path pairs naturally with backend scalability work, since client-side performance improvements are undermined when the API layer cannot keep pace.
Our take: optimising for outcomes, not just numbers
Having covered the technical aspects, here is a perspective worth sitting with. In our experience, the biggest risk in app performance work is not a lack of tools or techniques. It is optimising for the wrong thing.
Teams can spend weeks reducing API response time by 80 milliseconds while a confusing navigation flow is causing 30% of users to abandon a journey entirely. Raw benchmark improvements feel like progress, but they do not always translate to better business outcomes.
Conversion and journey-based outcomes reveal the real impact of performance work far more clearly than raw latency figures. At Duolingo, app open conversion is treated as a company-wide guardrail metric because it captures the full stack of performance factors in a single business-relevant number. That is the kind of thinking that transforms performance work from an engineering exercise into a strategic advantage.
Our strong recommendation is to bring product managers and UX leads into performance conversations from the start. They understand which journeys matter most to users and to the business. When they are involved in defining what "fast enough" actually means for a given flow, the technical work becomes far more focused and far easier to justify. Connecting optimisation to app feedback for retention closes the loop between engineering effort and real user sentiment.
Performance work is most powerful when it is framed as user experience investment, not infrastructure maintenance.
Need help optimising your app?
Optimising app performance does not have to be an internal guessing game. Whether you are dealing with slow start-up times, device-specific regressions, or a React Native codebase due for an architecture upgrade, professional guidance can help you identify the highest-impact changes and implement them with confidence.
Pocket App has delivered mobile app development services across more than 300 projects, helping clients in retail, healthcare, charity, and consumer sectors build apps that perform under real-world conditions. Our teams specialise in end-to-end performance diagnostics, UX-driven optimisation, and cross-platform app development using modern architectures. If you are ready to move from frustrating performance reviews to measurable improvements, get in touch to discuss how we can help.
Frequently asked questions
What is the most important metric for app performance?
App load time and perceived start-up latency are key technical indicators, but conversion and retention provide far greater business insight. At Duolingo, app open conversion is a company-wide guardrail metric precisely because it reflects the cumulative impact of all performance factors.
How often should performance be tested and optimised?
Performance should be monitored continuously in production and optimised iteratively. Monitor in production and iterate as a core principle, particularly after each major release cycle when new code introduces fresh risks.
What common mistake slows most apps?
Blocking the main thread during app start-up and loading large assets without progressive optimisation are the most widespread culprits. Images and blocking tasks at start-up significantly affect load time across both Android and iOS platforms.
How can performance be improved on low-end or older devices?
Capability-aware adaptation is the most reliable approach. Adapting to runtime memory pressure and thermal state using capability bands allows your app to deliver a resilient experience without sacrificing quality on higher-tier devices.
Does React Native limit app performance?
Older versions and default configurations can introduce bottlenecks, particularly around the bridge architecture. However, migrating to modern RN architectures such as Fabric and TurboModules significantly closes the performance gap with fully native development.