
TL;DR:
- Analytics in nonprofit apps helps organizations measure donor retention, fundraising channels, and program outcomes. Embedding analytics from the start enables real-time insights and improves decision-making while protecting donor privacy through aggregate and session-based data. Clear metric definitions and technical integration guide nonprofits toward more effective, data-driven impact.
Analytics in nonprofit apps is defined as the systematic collection, measurement, and interpretation of data to improve fundraising, programme delivery, and organisational decision-making. The role of analytics in nonprofit apps goes well beyond counting downloads or page views. It tells you which donors are at risk of lapsing, which fundraising channels deliver the best return, and whether your programmes are achieving measurable outcomes. For nonprofit professionals, this is the difference between reporting what happened and understanding why it happened. This guide covers the key metrics to track, how nonprofit analytics differs from standard business intelligence, and the practical steps to embed data into your app from day one.
What key metrics and insights do analytics provide for nonprofit apps?
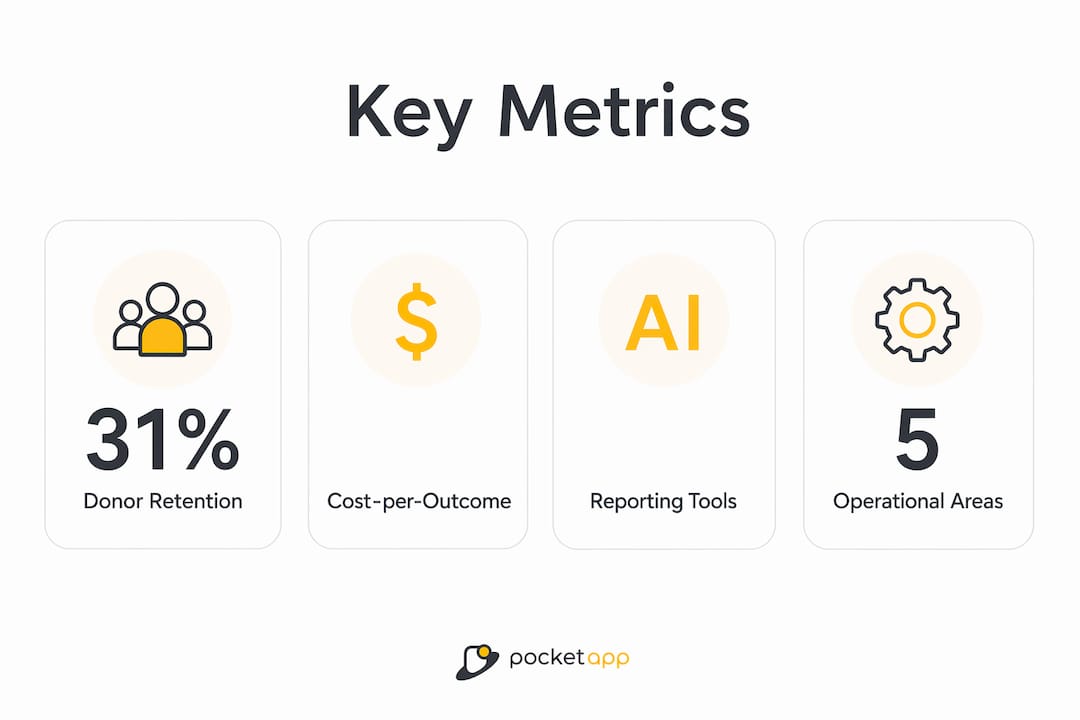
Analytics for nonprofit apps centres on five operational areas: donor retention, channel attribution, cost-per-outcome, grant utilisation, and app performance. Each area answers a question your board or funders will ask, and integrated analytics let you answer those questions in seconds rather than days.

The most financially significant metric is donor retention. Only 31% of new donors give a second gift, which means acquiring a new donor to replace a lapsed one costs far more than keeping the original supporter. Retention-focused analytics surface at-risk recurring donors early, giving your team time to intervene with a personalised message or a giving reminder.
Channel attribution tells you which campaigns, platforms, or referral sources actually drive donations. Without it, you are allocating budget by instinct. Cost-per-outcome connects your financial spend to programme results, which is the metric funders increasingly demand. Grant utilisation tracking shows whether restricted funds are being spent within the terms of the award.
App performance metrics sit alongside these mission metrics. Crash rates, load latency, and session drop-off points affect whether donors complete a gift or abandon the process entirely. A slow checkout screen is a fundraising problem, not just a technical one.
- Donor retention cohort analysis: Groups donors by acquisition date to identify when lapsing typically occurs.
- Channel attribution: Assigns donation value to the campaign or source that generated it.
- Cost-per-outcome: Divides programme spend by the number of measurable outcomes achieved.
- Grant utilisation rate: Tracks restricted fund spend against award conditions and deadlines.
- App crash and latency monitoring: Flags technical failures that disrupt the donor experience.
Pro Tip: AI-powered reporting tools now allow non-technical staff to generate custom visual dashboards instantly, reducing reporting time from days to minutes. This removes the analyst bottleneck that delays board decisions.
How do nonprofit app analytics differ from traditional business intelligence?
Standard business intelligence tools are built for commercial data: sales figures, web traffic, and conversion funnels. Nonprofit analytics requires something more complex. It must join primary participant data with secondary sources such as Census records, IRS filings, and demographic benchmarks to prove that a donor's investment produced real-world change.
A corporate dashboard shows revenue by region. A nonprofit dashboard must show that a specific programme, funded by a specific grant, improved outcomes for a defined population compared to a regional baseline. That requires contextual data joins that generic BI platforms were not designed to perform.
The logic model is the structural backbone of nonprofit programme analytics. It maps inputs (staff time, funding) through activities to outputs and outcomes, then to broader mission impact. Visualising performance against targets at each stage of the logic model tells leadership where to invest more and where to pull back.
| Dimension | Generic BI tools | Nonprofit-specific analytics |
|---|---|---|
| Primary data source | Transactional and sales data | Surveys, intake forms, programme records |
| Secondary data joins | Rarely required | Census, IRS, and sector benchmarks |
| Key output | Revenue and conversion metrics | Cost-per-outcome and impact attribution |
| User profile | Data analysts and finance teams | Programme staff and non-technical managers |
| Reporting cadence | Monthly or quarterly | Real-time and funder-cycle aligned |
Many nonprofits also face unprepared data. Unclear logic models mean that inputs and outputs are not consistently recorded, making advanced analysis unreliable. Aligning programme teams on metric definitions before deploying any analytics tool is not optional. It is the prerequisite.
AI-native analytics platforms address the analyst bottleneck directly. Plain-English query interfaces replace complex dashboard navigation, allowing a programme manager to ask "which cohort had the lowest cost-per-outcome last quarter?" and receive an answer without writing a single line of SQL.
What are best practices for integrating analytics into nonprofit app development?
The most common analytics mistake in nonprofit app projects is treating data as an afterthought. Failing to integrate event tracking from day one means you have no baseline against which to measure future changes. You cannot prove that a redesigned donation screen improved conversion if you never tracked the original conversion rate.
Follow this sequence when building analytics into a nonprofit app:
- Define your KPIs before writing a line of code. Start with 3–5 metrics focused on donor retention, cost-per-outcome, and grant utilisation. A minimal viable set of KPIs prevents data overload and ensures staff actually use the dashboards.
- Instrument every critical user action. Track button clicks, screen transitions, form completions, and payment funnel steps from the first build. This is your baseline data. Without it, you are guessing.
- Build a unified analytics infrastructure. Avoid pulling data from your CRM, finance system, and programme database separately. A unified data approach using a dedicated data warehouse gives you speed, accuracy, and a single source of truth.
- Choose tools your staff can actually use. Low-code and AI-native platforms let programme managers run their own reports without waiting for a data analyst. This is critical for organisations with small technical teams.
- Align with programme teams before launch. Analytics only works if the people generating the data understand why they are recording it. Run a workshop with programme staff to agree on metric definitions and data entry standards.
Pro Tip: Review your nonprofit app design workflows to confirm that event tracking is specified at the wireframe stage, not added during testing. Retrofitting tracking is expensive and often incomplete.
How can nonprofits overcome technical and privacy challenges in analytics?
Data fragmentation is the leading technical barrier to effective nonprofit analytics. Most organisations hold donor data in a CRM, financial data in an accounting system, and programme data in spreadsheets or a separate case management tool. Pulling these together in real time inside an app creates performance problems and data inconsistencies.
The solution is a dedicated data warehouse that aggregates and cleans data from all source systems on a scheduled basis. The app then queries the warehouse rather than the live source systems. This approach improves speed, reduces the risk of data corruption, and makes audit trails far cleaner for funder reporting.
Donor privacy is a separate but equally serious challenge. Analytics tools that access raw donor records create exposure under GDPR and erode the trust that sustains long-term giving. The recommended approach uses session-based and aggregate analytics rather than individual-level tracking.
- Session-based analytics: Tracks user behaviour within a session without storing personally identifiable information (PII) against a named record.
- Aggregate reporting: Presents data at cohort or segment level, making individual identification impossible.
- Self-hosted AI analytics tools: Keep all data on your own infrastructure, removing third-party data access risk.
- Privacy by design: Embed data security practices into the app architecture from the start, not as a compliance layer added later.
Protecting donor PII through aggregate tracking and self-hosted tools is the standard recommended by analytics specialists working in the nonprofit sector. Donors who trust your data practices give more consistently and for longer.
How do analytics insights translate into better decisions and impact?
Analytics insights change decisions at every level of a nonprofit, from a fundraising manager adjusting a campaign to a board approving a new programme investment. The mechanism is the same in each case: data replaces assumption.
A retention dashboard that flags donors who have not given in 90 days enables a targeted re-engagement campaign before those donors lapse entirely. Without the dashboard, the lapse goes unnoticed until the annual report reveals a drop in recurring income. The difference between these two scenarios is not strategy. It is data timing.
Channel attribution analysis shows which fundraising investments produce the highest return. An organisation spending equally across email, social media, and events may discover that email generates three times the return per pound spent. Reallocating budget based on that finding is a direct financial benefit of analytics.
At programme level, outcome analytics guide evidence-based adjustments. If a specific intervention shows low cost-per-outcome in one region and high cost-per-outcome in another, the data points to where delivery needs to change. Automating funder reports using tools like Power BI reduces staff time on compliance reporting by up to 80%, freeing capacity for programme delivery.
"The shift from manual reporting to real-time analytics is not just an efficiency gain. It changes what questions leadership is willing to ask, because they know the answers are available. Boards become more ambitious when data is accessible."
Predictive analytics extends this further. By modelling historical giving patterns, an app can flag donors likely to upgrade their gift, identify seasonal giving peaks, and anticipate grant renewal risks. This moves data-driven decision making from reactive to genuinely forward-looking.
Key takeaways
Analytics embedded in nonprofit apps transforms raw data into decisions that directly improve fundraising outcomes, programme effectiveness, and donor retention.
| Point | Details |
|---|---|
| Start with 3–5 KPIs | Focus on donor retention, cost-per-outcome, and grant utilisation to avoid data overload. |
| Track events from day one | Baseline data from launch is the only way to measure the impact of future changes. |
| Use a dedicated data warehouse | Centralised data integration improves speed, accuracy, and funder reporting reliability. |
| Protect donor privacy by design | Session-based and aggregate analytics safeguard PII and maintain long-term donor trust. |
| Align programme teams first | Consistent metric definitions across staff are the prerequisite for reliable analytics. |
Analytics and nonprofit apps: what I have learned
The organisations I have seen get the most from analytics are not the ones with the biggest data teams. They are the ones that decided, early in their app project, exactly what three questions they needed to answer. Everything else followed from that clarity.
The most common mistake is deploying a full analytics suite before the organisation has agreed on what a "successful outcome" actually means. You end up with beautiful dashboards that nobody trusts because the underlying data definitions are inconsistent. Programme staff record outcomes differently from finance staff, and the numbers never reconcile.
The shift to AI-native analytics is genuinely significant for nonprofits with small teams. When a programme manager can type a question in plain English and receive a reliable answer, the data team stops being a bottleneck and starts being a resource. That cultural shift, where evidence becomes part of everyday decisions rather than a quarterly reporting exercise, is where the real impact lives.
Privacy deserves more attention than most nonprofit app briefs give it. Donors are increasingly aware of how their data is used. An organisation that can explain, clearly and simply, that its app uses aggregate analytics and never shares individual records has a genuine trust advantage. That trust translates directly into retention.
My honest recommendation: treat your analytics architecture as seriously as your app design. Both shape the experience your donors and programme participants have. One is just visible, and the other is not.
— Paul
How Pocketapp builds analytics into nonprofit apps
Pocketapp has delivered over 300 mobile app projects, including work for organisations like WWF, where analytics and user experience are inseparable from mission outcomes.
When Pocketapp develops a nonprofit app, analytics architecture is specified at the discovery stage, not added after launch. Event tracking, KPI frameworks, and data warehouse integration are built into the technical specification from the first sprint. If you are planning a charity app development project and want analytics embedded from the ground up, Pocketapp's team brings both the technical depth and the sector understanding to make it work. Explore Pocketapp's mobile app development services to see how analytics-first design translates into measurable impact for nonprofits.
FAQ
What is the role of analytics in nonprofit apps?
Analytics in nonprofit apps measures donor behaviour, programme outcomes, and operational performance to support evidence-based decisions. Organisations using integrated analytics can answer board questions on donor retention and campaign ROI in seconds rather than days.
Which metrics should a nonprofit app track first?
Start with donor retention rate, cost-per-outcome, and grant utilisation. A minimal viable set of 3–5 KPIs prevents data overload and ensures reliable, consistent reporting from launch.
How does nonprofit analytics differ from standard BI tools?
Nonprofit analytics joins primary participant data with secondary sources such as Census and IRS records to attribute impact to specific donor investments. Standard BI tools are built for transactional data and do not support this type of contextual join.
How can nonprofits protect donor privacy in app analytics?
Use session-based and aggregate analytics rather than individual-level tracking, and consider self-hosted AI analytics tools that keep all data on your own infrastructure. This approach protects personally identifiable information while still enabling advanced reporting.
When should analytics be integrated into a nonprofit app project?
Analytics should be integrated at the discovery and specification stage, before any development begins. Failing to track events from day one means you have no baseline data to measure the impact of future design or feature changes.